Reporting & Analysis

Dashboard

Continuously monitor the health of your business by turning your data into an insightful clear picture

Dashboard

Using data more effectively is a constant priority for CFOs and business leaders alike. 

The power of data analysis is enabling employees to gather a wide variety of information and spin it into actionable insights on new business opportunities as well as ways to optimise current operations and reduce costs.

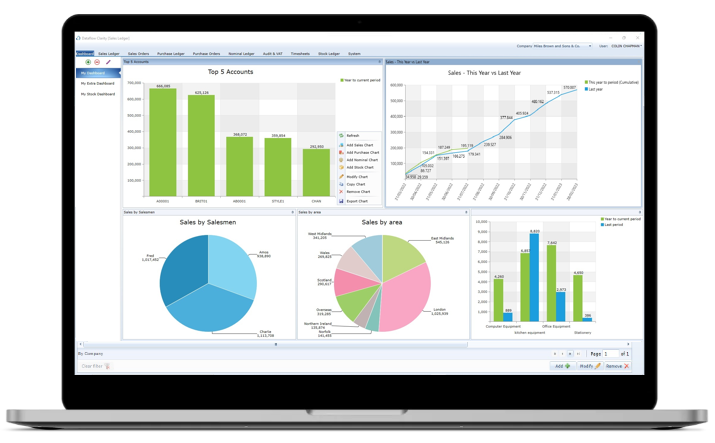
You can create dynamic visualizations, and transform data with simple and user-friendly tools in minutes.

Dashboard turns data into insights and gives you the context you need for faster, better-informed decisions by moving from reactive reporting to proactive insights by getting real-time access to business metrics.

Dashboard

Key Benefits

  • Interactive dashboards help every business user understand, explore, and use real-time data on a daily basis
  • Transform raw data into visualizations that make it easier to interpret and quickly find answers to business questions
  • Explore your data with interactive filtering to quickly find answers to business questions
  • Equip your teams to visualize and analyse data through Clarity’s intuitive interface to make smarter decisions
  • Provide real-time business intelligence
  • Empower business users to visualize and analyse data
  • Make analytics accessible with interactive, customizable dashboards that tell a story with real-time data
  • Whether you sit in finance, sales, marketing, purchasing or IT, Clarity’s dashboard puts data at the forefront of your business operations
  • Tailor your dashboard based on business metrics you care about or add your own custom filters
  • Access control ensures that only authorised users can access sensitive data

Related Products